


Power BI for Executives: Data Storytelling & Decision-Making

In today’s data-driven economy, executives are surrounded by more information than ever before. Sales numbers, operational metrics, financial forecasts, customer behavior data, and market signals arrive daily—often fragmented across tools, teams, and reports. Yet, despite this abundance of data, many leaders still struggle to get clear answers to simple but critical questions: Are we on track? What’s changing? Where should we act next?
 This is where Power BI for executives becomes transformative. More than a reporting tool, Power BI serves as a strategic storytelling platform, turning raw data into meaningful narratives that support faster, smarter, and more confident decision-making at the leadership level.
What is Power BI ?
Power BI is Microsoft’s business intelligence and data visualization platform that transforms raw data from multiple sources into interactive dashboards and reports. Data storytelling is the practice of using visual narratives ,charts, trends, annotations, and guided analysis paths ,to communicate data-driven insights in a format that enables fast, confident executive decision-making.
Why Traditional Reporting Fails Executives
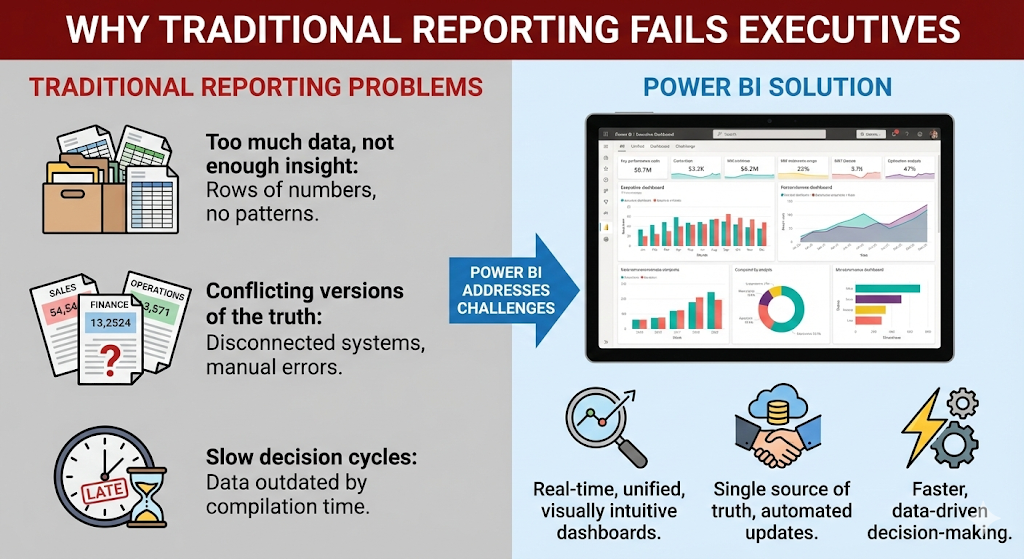
Most organizations still rely on static reports, spreadsheets, or department-specific dashboards. These approaches create three major problems for leadership:
-
- Too much data, not enough insight: Executives don’t need rows of numbers—they need patterns, trends, and risks highlighted instantly.
- Conflicting versions of the truth: Sales, finance, and operations often report different numbers due to disconnected systems and manual reporting.
- Slow decision cycles: By the time reports are compiled and reviewed, the data is already outdated.
Power BI addresses these challenges by providing real-time, unified, and visually intuitive dashboards designed specifically for executive consumption.
Power BI as an Executive Storytelling Platform
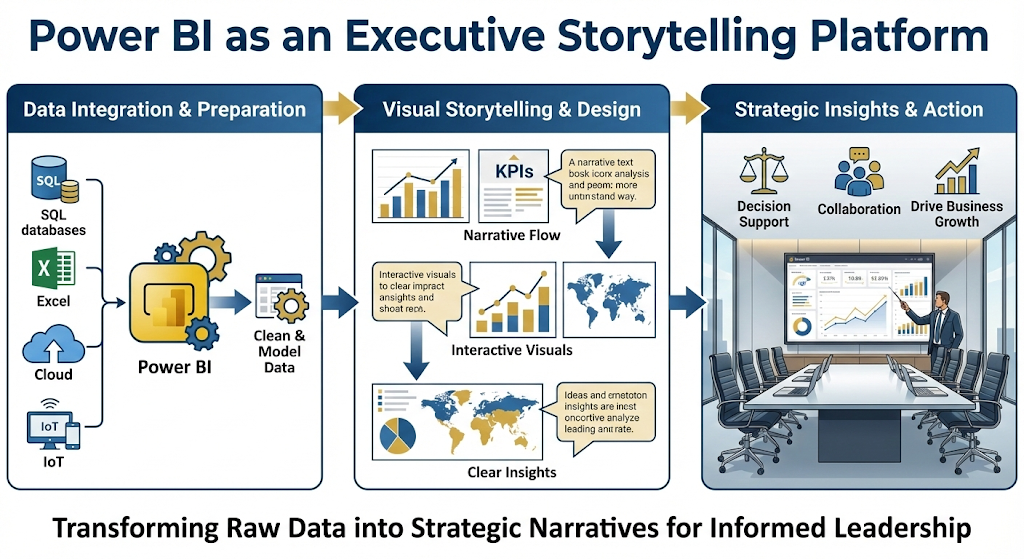 At its core, data storytelling is the ability to communicate insights through a combination of data, visuals, and narrative context. For executives, storytelling is not about charts for charts’ sake; it is about understanding why numbers are changing and what actions should follow.
Power BI excels at this by organizing complex datasets into intuitive dashboards that guide leaders through a logical story. Instead of scanning rows of figures, executives can see performance unfold visually—revenue trends over time, margin shifts by product line, pipeline health by region, or customer churn signals emerging across segments.
A well-designed Power BI executive dashboard doesn’t overwhelm. It highlights what matters most first, then allows leaders to explore deeper only when needed. This balance between simplicity and depth is what makes Power BI particularly powerful for the C-suite.
Turning KPIs into Business Narratives
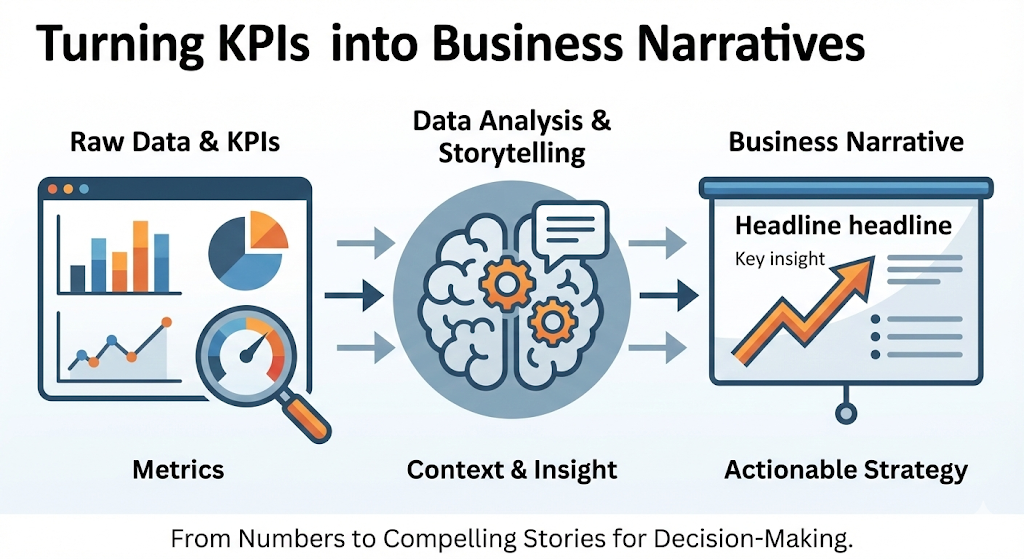 Executives live by KPIs, but KPIs alone don’t tell the full story. A revenue number without context raises questions. Is growth sustainable? Is it driven by volume or pricing? Which regions or products are contributing—or dragging performance down?
Power BI enables executives to view KPIs as part of a connected narrative. For example, a CEO reviewing a monthly dashboard might see revenue tracking below target. With a few interactions, they can immediately identify whether the issue lies in slower deal velocity, declining conversion rates, regional underperformance, or rising churn. This ability to move from headline metrics to root causes—without waiting for another report—dramatically improves decision speed.
More importantly, Power BI helps leaders track leading indicators, not just lagging results. Pipeline quality, customer engagement trends, operational bottlenecks, and workforce utilization often signal future outcomes before they appear in financial statements. Executives who monitor these signals consistently are better positioned to act proactively rather than react defensively.
Executive Decision-Making Powered by Real-Time Insights
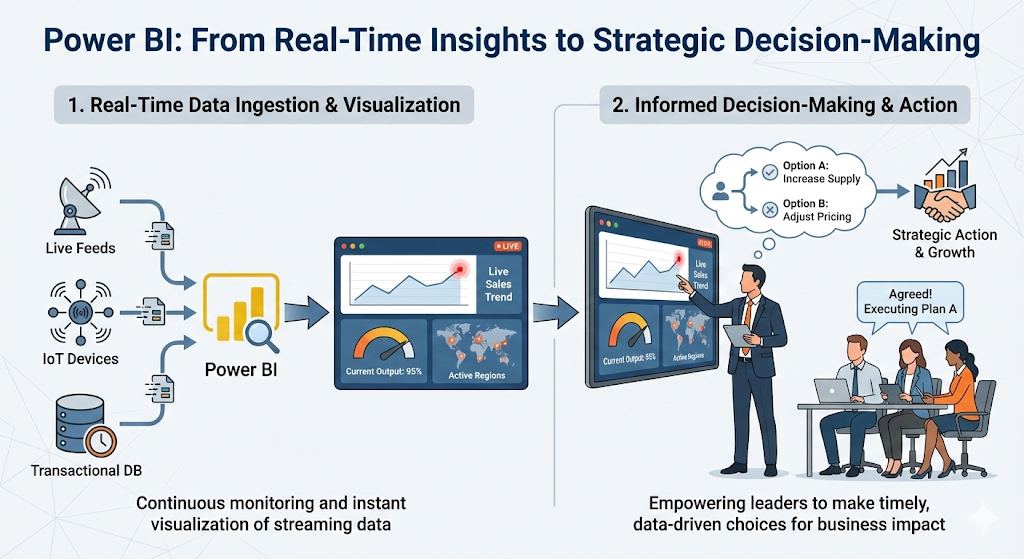 Strategic decisions often need to be made in compressed timeframes. Market conditions shift, customer expectations evolve, and competitive pressures intensify. Relying on outdated data in such an environment is a risk few organizations can afford.
Power BI supports near real-time decision-making by connecting directly to core business systems such as ERP, CRM, finance platforms, and operational databases. Instead of waiting weeks for consolidated reports, executives can review current performance during leadership meetings, board discussions, or strategic planning sessions.
This immediacy changes how decisions are made. Conversations move away from debating numbers toward discussing actions. Leaders can test assumptions, explore scenarios, and align quickly on priorities because everyone is looking at the same data, presented in the same way.
The Role of Visualization in Executive Clarity
Visual design is not cosmetic—it is functional. Executives process information quickly and often under pressure. Power BI’s visualization capabilities are designed to support rapid comprehension by emphasizing trends, contrasts, and exceptions rather than dense detail.
Clear charts, consistent color logic, and thoughtful layout help leaders identify what deserves attention within seconds. A sudden dip in margin, a spike in customer complaints, or a stalled project becomes immediately visible. This visual clarity reduces cognitive load and enables executives to focus on judgment and strategy rather than interpretation.
When dashboards are designed specifically for executive use—rather than repurposed from analyst reports—they become powerful leadership tools rather than passive monitoring screens.
Aligning Leadership Teams Around a Single Source of Truth
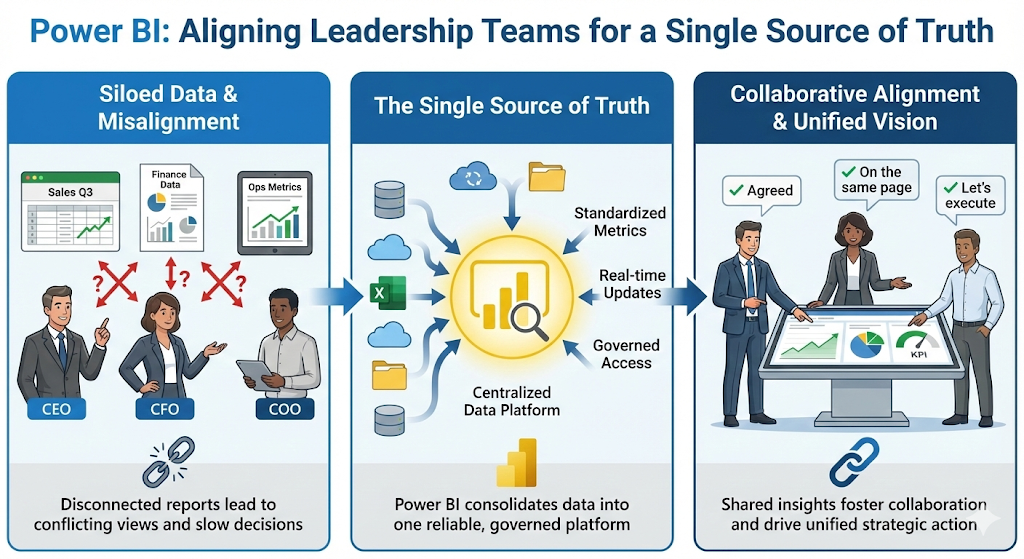 One of the most underestimated benefits of Power BI for executives is organizational alignment. When leadership teams rely on different reports from different departments, decision-making slows and trust erodes. Disagreements often center on whose data is correct rather than what action should be taken.
Power BI establishes a shared, governed data foundation. Executives, department heads, and managers can all access the same dashboards, tailored to their level of responsibility but grounded in the same underlying data model. This consistency builds confidence, improves accountability, and fosters more productive discussions across the organization.
For board reporting, this alignment is especially valuable. Executives can present insights visually, answer questions in real time, and demonstrate control over business performance with clarity and credibility.
Strategic Use Cases Where Power BI Delivers Executive Value
 Power BI’s impact on executive decision-making spans multiple domains. In finance, it supports profitability analysis, cash flow monitoring, and budget variance tracking. In sales, it reveals pipeline health, forecast accuracy, and regional performance patterns. In operations, it highlights efficiency gaps, delivery risks, and capacity constraints. In customer experience, it surfaces churn risks, satisfaction trends, and lifetime value dynamics.
What connects these use cases is not the data itself, but the ability to see the story behind the numbers. Executives are no longer limited to periodic snapshots; they gain a continuous, evolving view of business health.
From Insight to Action: Closing the Executive Loop
Insight without action has limited value. Power BI enables executives to move seamlessly from understanding to execution by supporting deeper exploration, scenario analysis, and follow-up discussions.
When leaders can identify issues early, validate assumptions quickly, and track the impact of decisions over time, they create a virtuous cycle of learning and improvement. Over time, organizations mature from reactive reporting cultures into truly data-driven leadership environments.
This shift is not just technological—it is cultural. Power BI becomes the medium through which strategy is monitored, refined, and reinforced.
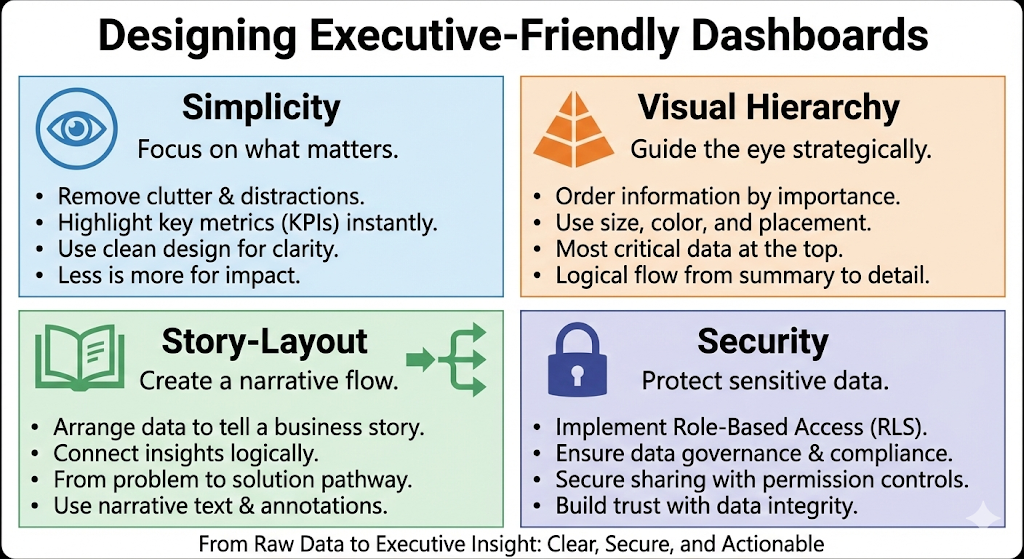
Designing Executive-Friendly Power BI Dashboards
Not all dashboards are executive-ready. Effective Power BI dashboards for executives should follow these principles:
-
- Simplicity Over Density: Executives want clarity, not clutter. Focus on high-impact KPIs.
- Visual Hierarchy: Highlight what matters most using size, color, and placement.
- Story-Driven Layout: Organize dashboards to tell a logical business story from top to bottom.
- Consistent Metrics: Ensure all departments align on definitions to maintain trust.
- Security & Governance: Role-based access ensures sensitive data is protected.
Conclusion: Leading with Confidence Through Data Storytelling
In an era defined by complexity and speed, executives need more than intuition alone. They need data that speaks clearly, insights that arrive on time, and narratives that support decisive action.

Power BI empowers executives to move beyond static reports and fragmented metrics toward a unified, visual, and interactive understanding of their business. By combining data storytelling with real-time insights, Power BI transforms decision-making from reactive to strategic.
For leaders who want to see the full picture, anticipate change, and guide their organizations with confidence, Power BI is not just a BI tool—it is an executive command center.
Key Takeaway
This article addresses the executive challenge of information overload — too much data, fragmented across tools, without a clear narrative. It explains how Power BI bridges the gap between raw operational data and executive decision-making by providing real-time KPI dashboards, drill-through capability for root-cause analysis, and mobile-accessible reports. Key sections cover: designing executive-level dashboards (what metrics belong at the top level), using bookmarks and drill-through for guided data storytelling, setting up Row-Level Security for board-level reporting, and connecting Power BI to common executive data sources (Dynamics 365, Salesforce, Azure SQL).